



The Eight Wastes in Services: The Invisible Enemy
In a factory, when waste happens, it shows. A heap of defective parts in a corner of the workshop, a box of expired materials, a stopped machine whistling. Waste there has a body and a weight, so it can be measured and someone can be held to account for it. In a service office there is no heap. The employee is at their desk, the systems are running, the lights are on, and the organisation bleeds without feeling it. This is what Hind discovered one ordinary day, when she asked her team to trace a single request from start to finish.
This article follows Hind as she learns to see. You will leave with a map of the eight wastes in services, translated from factory language into office language, with simple questions that reveal each one, and a structured way to remove them without falling into two common traps. Each section ends with a short exercise to apply to a real process in your own organisation.
“Hind, her company and every figure in this article form a hypothetical case written for illustration only. They do not refer to any real organisation.”
Hind and the request that takes only half an hour
Hind runs the back office of an imaginary services company. One of its most frequent requests is the customer data update: a customer wants to change a mobile number, an address, or the name of an authorised representative. Nobody considers it a complicated request. When she asked her staff how long the work on it really takes, they answered almost in one voice: about thirty minutes.
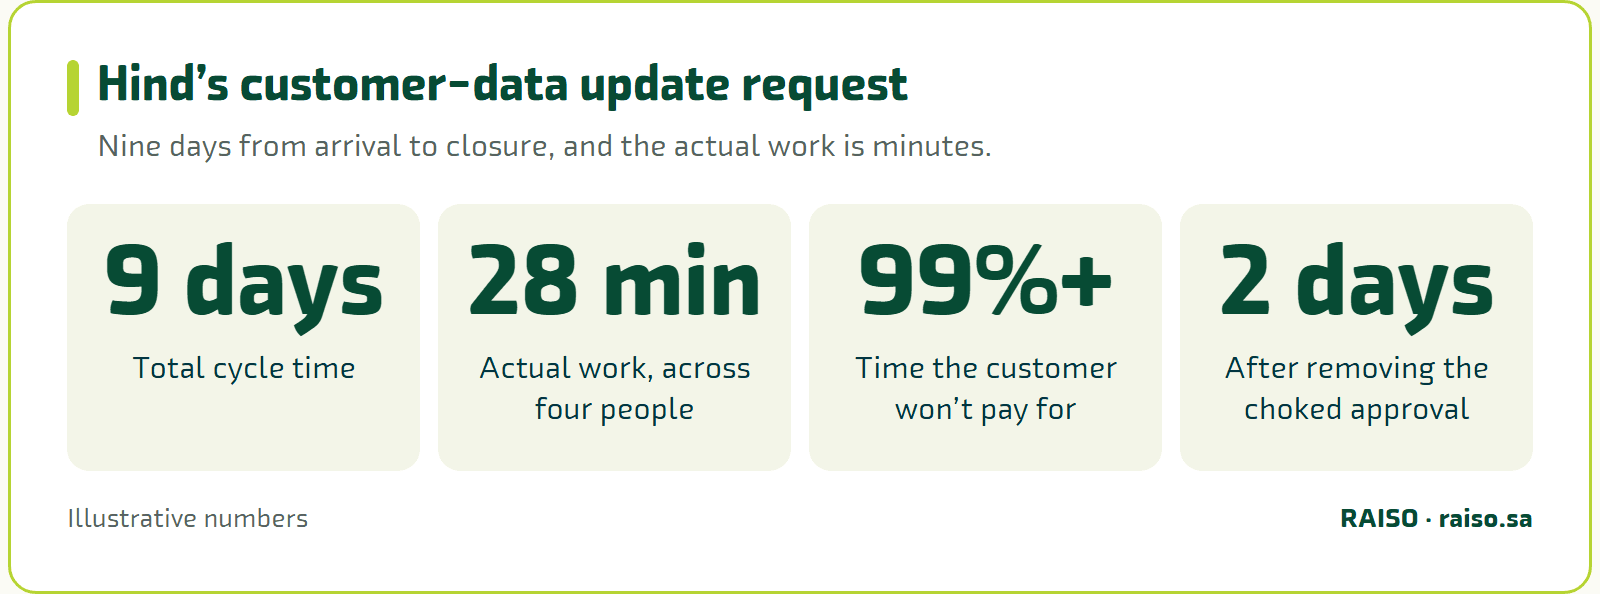
Hind asked her team to pick a real request and trace it with pen and paper: when did it arrive? Who touched it? How long did it sit in each place? When they added it up they found the request had been closed after nine days. Of those nine days, the actual work on the request was about twenty-eight minutes, spread across four people. The rest was waiting.
The figures are simple but shocking. Nobody was negligent. There was no lazy person on the team and no system failure. Each person did their part diligently. Yet more than ninety-nine percent of the request’s time vanished into things the customer would not pay for. This is the enemy we speak of in this article.
Where the case stands now: Hind faces a question that is new to her. It is no longer why staff are slow, but what happens to a request when nobody is working on it. This question needs new glasses, and we learn to make them in the sections ahead.
“Pick one request closed recently in your organisation and ask: how long did it take from the moment it arrived to the moment it closed? And how much of that time did a person actually work on it? Precision is not needed, a rough estimate is enough.”
Why does waste hide in services?
The first question Hind asked herself was: how did we never see this before? The answer begins with a simple difference between factory and office. A factory’s product is physical, while a service’s product is information. When a transaction stalls in a drawer, its shape and weight do not change, and on day thirty it looks just as it did on day one. When office work is redone three times, the faulty copies do not pile up in a corner to embarrass anyone. The old ones are deleted as if they never existed.
The second reason is that waste in services wears the clothes of respectable work. The employee who re-enters the same data in three systems looks busy and productive. The meeting of twelve people to decide something that concerns three of them looks like sound governance. The monthly report nobody reads looks like a commitment to transparency. In a factory waste looks like a mistake, in an office it looks like diligence. That is why resisting it is harder: you are not fighting laziness, you are fighting activity in the wrong place.
The third reason is the absence of the scrap heap. In manufacturing the heap is visible evidence that forces a question. In services the cost is spread across thousands of small moments: minutes of waiting here, re-entry there, an unnecessary signature above, a wasted skill below. No single moment catches the eye, but together they are the largest unmeasured cost. They never show up in financial statements, because they are buried in salaries that get paid anyway, and in a cycle time that has come to be considered normal.
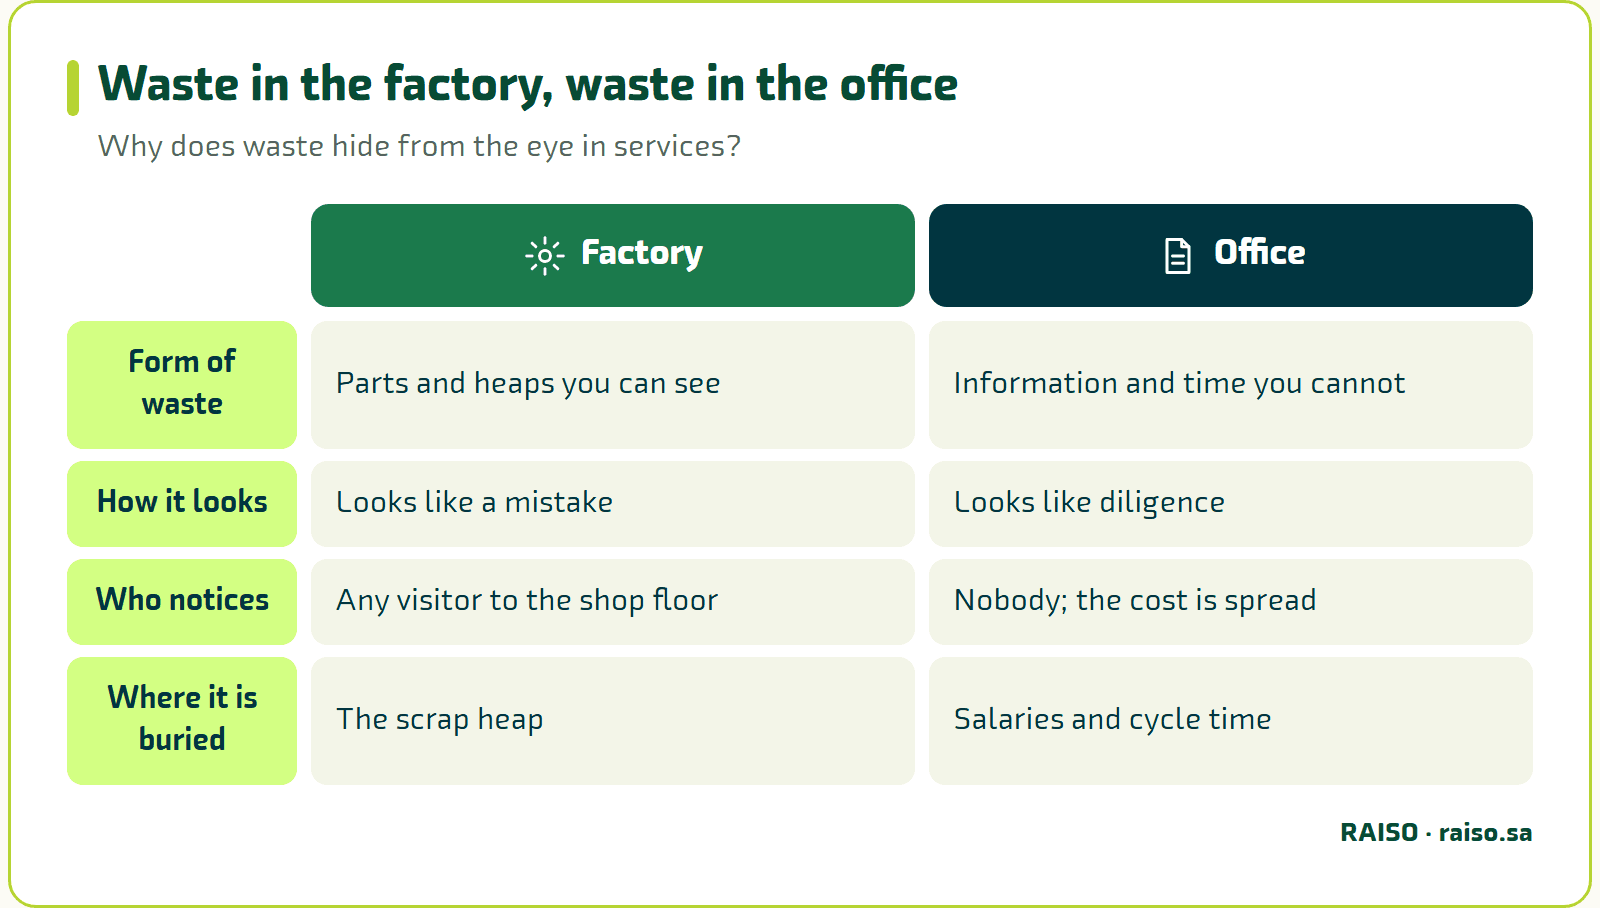
“In a factory waste looks like a mistake, in an office it looks like diligence. That is why resisting it is harder: you are not fighting laziness, you are fighting activity in the wrong place.”
Where the case stands now: Hind understood why nobody on her team had said that the request takes nine days. Because none of them had seen all nine days. Each had seen only their own part. The waste lived in the gaps between the parts, where nobody looks.
“In your process, who sees the whole journey from the first request to the last? If there is no single person who does, write that down. It is the first thing you will treat.”
Map of the enemy: the eight wastes
Before we chase an enemy we must know its face. The Lean methodology, born in car factories, identified eight types of waste. Waste in its definition is any activity that consumes resources without adding value the customer would willingly pay for. They are usually remembered through an English acronym, DOWNTIME, which also means exactly that, a clever hint that every one of these types is a stop in creating value.
The eight types, as they look in the office:
- Defects
Work done wrongly and needing correction or redoing, such as incomplete data returned days later.
- Overproduction
Producing what is not needed, or before it is needed, or more than is asked, such as a report nobody reads.
- Waiting
Time lost awaiting the next step, an approval or a piece of information.
- Non-utilized talent
Wasting people’s skills and ideas, such as an expert spending half the day on routine anyone could do.
- Transportation
Moving the transaction, file or information between hands and systems for no reason.
- Inventory
Accumulated work waiting to be processed: pending requests and transactions.
- Motion
Moving the employee between screens, systems and documents to complete a task.
- Extra-processing
Effort beyond what the value requires: steps, approvals and details nobody asks for.
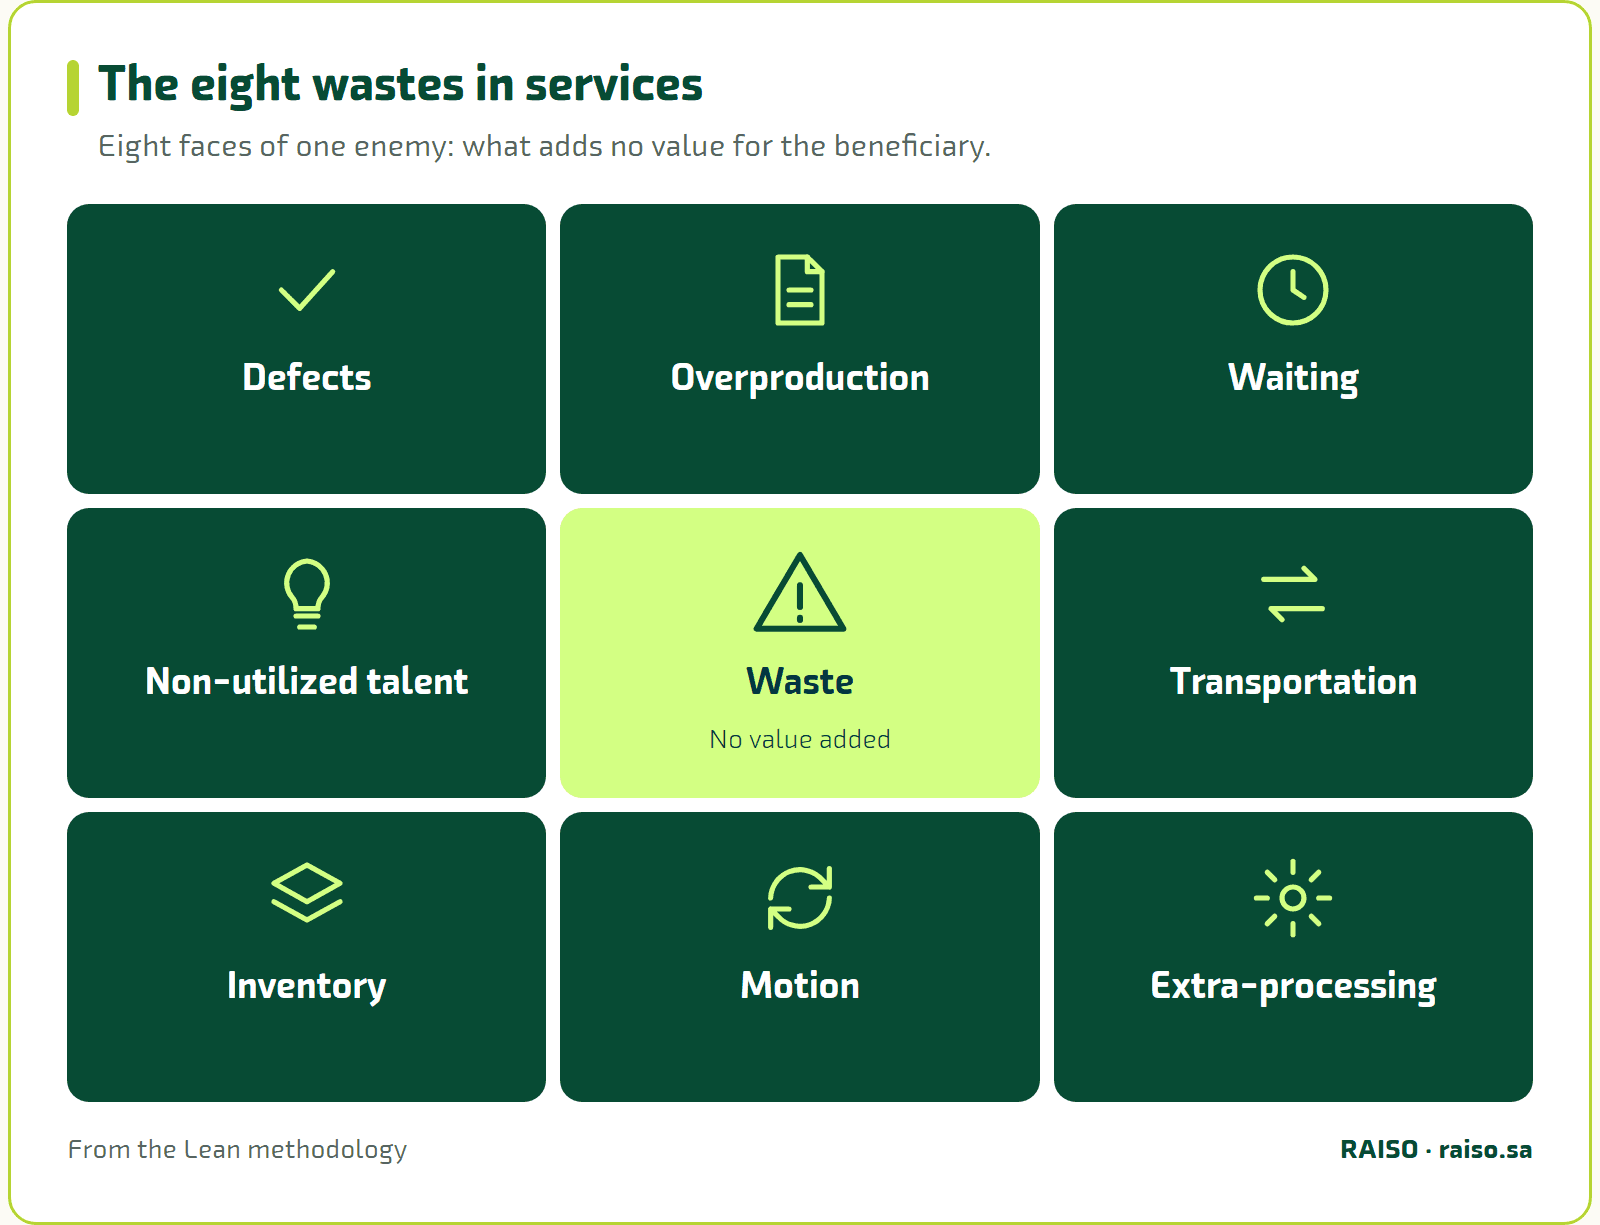
In the next sections we take each type, take off its factory clothes and dress it in office ones, with examples from Hind’s request. The aim is not to memorise the list but to learn how to see. After that we ask how to see and how to remove.
Where the case stands now: Hind pinned the list to the team board and put a question beside each type: have we seen this in the data update request? The answers began to gather.
Defects and overproduction: work that is redone and work that is never read
Hind began with defects, because they are the easiest to see when tracing a request. In manufacturing a defect is a part outside specification. In a service it is a transaction entered with incomplete data, a request rejected for missing attachments, or a wrong reply that needs a second one to correct it. The defect is not thrown into a bin. It returns as rework that consumes twice the time: once for the mistake and once for fixing it.
In the request Hind traced, a mobile number was entered one digit short at reception. A colleague in another department discovered it three days later when the confirmation message failed to send. The request was returned to reception, another employee re-entered it, and to the system it looked like a new request. Here the hidden loop appeared: the error was made at one point, found at a second and fixed at a third, and nobody connected them because they were never counted as a single request handled three times.
More dangerous than the defect itself is when the rework rate becomes normal. In many offices it is accepted that a sizeable share of transactions will come back, and the team’s capacity is built on that assumption. The defect then turns from an accident into a fixture: we hire, allocate time and build systems to handle errors that should never have occurred.
Overproduction, by contrast, is the mother of wastes in Lean thinking, because it breeds the others. In a factory it means making more units than the market asks for. In a service it means producing information and work nobody needs: a report prepared weekly because it always was, data collected because we might need it one day, paper copies printed just in case.
Hind found overproduction in the update form itself. The form asks the customer for twenty fields, yet the decision uses only six. The other fourteen consume the customer’s time in filling them, the employee’s time in entering them and system space in storing them, and serve no decision. Simplifying the form to what is used is not laxity but a direct application of resisting overproduction. And extra fields raise the chance of defects, since every added field is a chance for a new mistake.
The revealing question for defects is: how many times has this transaction come back to us? For overproduction: who consumes this output, when, and what do they do with it? If the second has no specific answer we are looking at overproduction. The remedy is to work to real demand rather than a hypothetical precaution: no report without a reader and no field without a decision. For defects, move from inspecting after the error to preventing it at source, with forms that will not submit unless complete and checklists at the point of entry.
Where the case stands now: Hind proposed three small changes. A form with six fields only, automatic checking of the mobile number format at entry, and deletion of a weekly report on requests that had been prepared for years, after she asked three of its recipients and none of them used it.
“Open a form your organisation asks people to fill and mark every field that feeds no decision. Then choose one regular report and ask its recipients: what did you do with it last time?”
Waiting and inventory: the days when nobody works
When Hind drew the request’s journey with its timings, the waiting stood out beyond denial. The actual working time was minutes and the waiting time was days. The request did not wait because the work on it was hard, but because it was stuck in an inbox awaiting approval, in a queue awaiting its turn, or between two departments awaiting someone to pick it up.
Waiting in services is of two kinds: waiting the customer suffers and waiting the work suffers. The first is visible and painful: a customer in a queue, on a phone line, or expecting a message that never comes. The second is hidden but costlier: the request itself waiting between one step and the next. Because a request does not complain, its waiting is forgotten, though it is the largest item in total cycle time.
The source of waiting is usually not the employee’s slowness but the design of the process: many hand-offs between many hands, approvals in sequence rather than in parallel, systems that do not talk so manual transfer must be awaited, and allocation rules that pile work on one person and leave another idle. Every hand-off between two people is a potential waiting point, and every added approval is a new queue.
Inventory is accumulated work waiting to be processed. In a factory it is shelves of material. In a service it is pending requests, unanswered messages and files marked under study. It is the most hidden of all the types: a thousand requests stuck in a system take no space and make no sound. Many organisations do not even know its size: how many pending requests? Since when? With whom? The absence of that number is itself proof that the inventory is hidden.
And inventory is not a static burden but a cost that grows with time. Each piled-up request sees its data go stale and its context change, and it may need rework when reopened after a long wait. The customer behind that request does not know they are inventory. They see only that their request is not done, and their trust erodes in silence. A large inventory is not a sign of healthy busyness but a symptom of a flow problem: work enters faster than it leaves.
How do we see these two? We measure the share of time in which value was actually added against total cycle time, and we count work in progress and its age. How do we remove them? By cutting hand-offs, turning sequential approvals into parallel ones where possible, delegating small decisions to those who do the work rather than escalating them, setting a ceiling on work in progress to prevent pile-ups, and processing the oldest first.
Where the case stands now: Hind calculated the ratio for the update request: twenty-eight minutes out of nine days. Then she stood in front of the pending-requests list for the first time in her career and found dozens of old requests stuck at a single approval. She decided to start there, because it was the largest choke point.
“Count the pending requests in one of your processes and write the age of the oldest. Then work out: in how many steps of its journey is nobody working on the request at all?”
Transportation and motion: two journeys with no value
Two types look alike and are often confused, yet telling them apart sharpens the eye. Transportation is moving the object of the work, the transaction, file or information, between people and systems. Motion is moving the person themselves to do their work. In a factory: moving the product between workshops, and the worker moving among their tools.
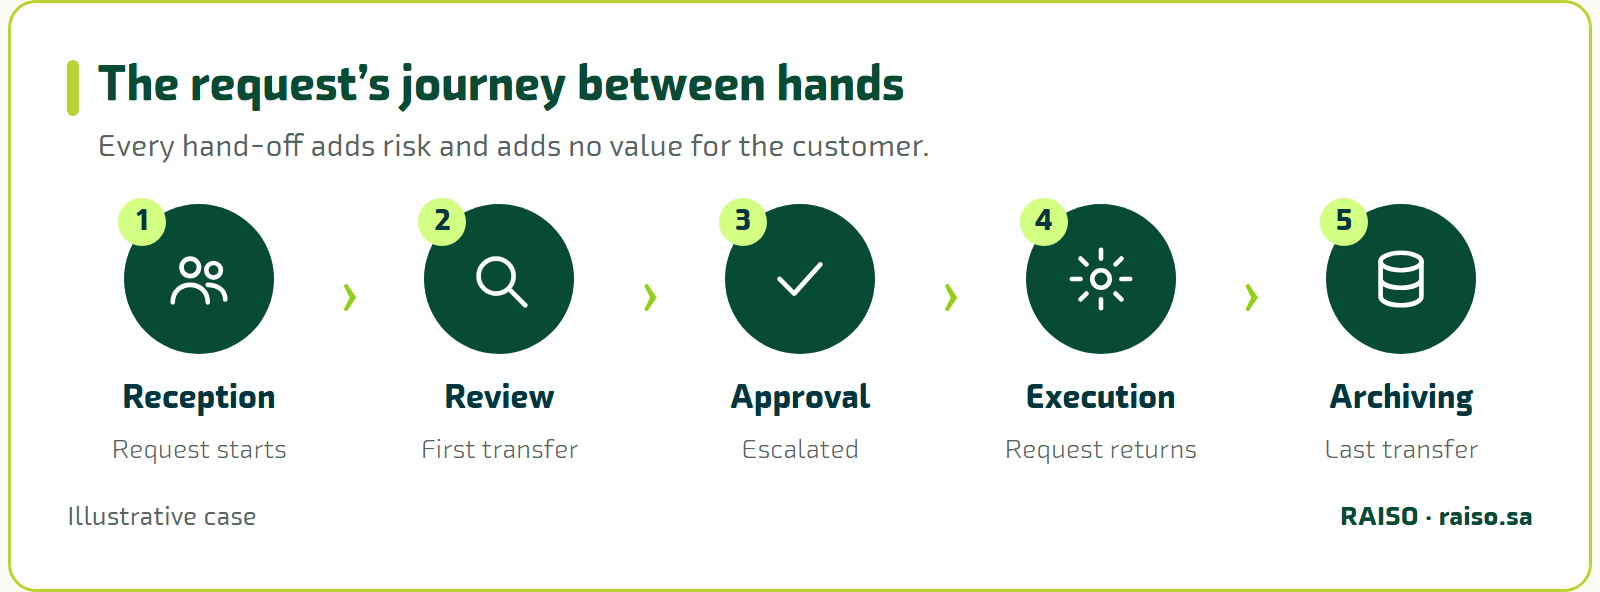
Transportation in Hind’s request showed in its journey between hands. It starts at reception, is forwarded to review, then escalated for approval, returns for execution, then goes to archiving. Every transfer in that chain adds nothing for the customer. On the contrary, each hand-off carries the risk of lost context, delay and repeated explanation. The more stations, the more transportation, and with it more waiting points and defects. A request that passes five desks to do work that two would handle carries three surplus transportation stops.
Motion, on the other hand, is the employee’s journey, not the request’s. An employee on Hind’s team opened four systems in four windows to finish one request: the customer system, the billing system, the requests system and a shared file. They copied data from one screen to another. Each system had a different password. This is office motion with no value for the customer, whose minutes pile up through the day into hours.
How do we see them? We draw a map tracing the request’s journey between stations and the employee’s journey between systems, and we count the stops. How do we remove them? By merging steps to cut hand-offs, linking systems or unifying their interface so the task is done from one window, and bringing information and tools closer to where they are used. The shortest journey for the request and for the employee is always the most valuable.
Where the case stands now: Hind’s team counted the stations and found seven. They saw that two would do: one for verification and one for execution. Hind sat with an employee handling a request and saw with her own eyes how many times they copied and pasted the same number. She told herself: had I seen this before, I would not have needed a report.
“Sit beside an employee handling a transaction from start to finish, without intervening, and count how many systems and windows they open and how many times they copy the same information.”
Non-utilized talent and extra-processing
The first seven types speak of material and time, and an eighth was added to speak of wasting people: non-utilized talent. This type is the most dangerous and the least obvious in services, because a service organisation’s capital is the minds of its staff, not its machines. When an employee’s skill is wasted, the very source of value is wasted.
Hind found this waste in Amjad, the longest-serving member of her team. Amjad knows exactly why requests stall at approval, and twice he proposed a simple fix. His suggestion was not rejected outright, but it was never answered at all. Then Amjad stopped suggesting. This is the bitterest form of waste: after being ignored a few times, the employee learns that silence is safer, and the organisation loses not one idea but the source of ideas.
The picture has another face: experts spending half their day on routine tasks anyone could do, and knowledge walking out the door the day its owner retires because it was never documented. All of these are energies that exist and are paid for in full but sit idle. The largest mine of improvement in any service organisation is minds that have not yet been asked.
Extra-processing is effort beyond what the value requires: needless steps, approvals that add no assurance, details the customer never asked for. In a factory it is polishing a surface nobody will see. In a service it is the fifth signature on a transaction that two would cover, or the fifty-page report when one page would do.
Its clearest form is the approval chain. Each signature in a chain is supposed to add assurance, but after a certain number it becomes ritual: the signer signs because the procedure demands it, without reading. Another, subtler form is uniform processing of different cases. When we put a simple request through the same path as a complex one, we handle ninety percent of cases with a procedure designed for a rare exception.
The revealing question for talent: is there a real channel where the ideas of those who do the work are heard and acted on? And what share of our experts’ time goes on work that does not need their expertise? For extra-processing: what would the customer lose if we dropped this step? If the answer is nothing, it is extra-processing. In both cases the remedy is to move the decision to the point nearest the work, sort cases so the simple ones take a fast path and the complex ones a deeper path, and abolish every approval that does not change the decision.
Where the case stands now: Hind invited Amjad to the team meeting and asked him to explain his proposal to everyone. It turned out his fix removed a whole approval that never changed the outcome. The following week the approval was deleted, and the simple request now travels a fast path of two stations.
“Ask the longest-serving person on your team: what do you see every day that slows the work and nobody has asked you about? And listen without defending.”
| # | Waste type | Revealing question | Compliant | Partly compliant | Non-compliant |
|---|---|---|---|---|---|
| 1 | Defects | Is the step done right the first time? | |||
| 2 | Overproduction | Does anyone actually need the step’s output, and when? | |||
| 3 | Waiting | How long does the request wait before and after the step? | |||
| 4 | Talent | Is the doer’s skill used, or does someone more senior do it? | |||
| 5 | Transportation | How often does the request move between hands and systems? | |||
| 6 | Inventory | How many requests are queuing at this step? | |||
| 7 | Motion | How many systems and screens does the employee move between? | |||
| 8 | Extra-processing | What would the customer lose if we removed the step or approval? |
Ask each step of your process and tick the answer by what you saw.
How do you see what is not seen?
Knowing the eight types is necessary but not sufficient. A list alone does not reveal waste. A structured method of looking does. The first and strongest is walking the workplace, called Gemba in Japanese: the leader goes to where work is actually done instead of only reading reports at their desk. A report shows tidied numbers. Walking among desks shows the request waiting, the employee copying between screens, and the queue lengthening.
The second tool is value stream mapping: drawing the whole process from the customer’s request to its delivery and recording for each step its actual time and the waiting time after it. Once the map is in front of us, the waiting, transport and inventory are laid bare. And the truth Hind saw emerges: the share of time that adds value, against total cycle time, is tiny. That ratio alone is the most honest measure of a process’s health.
To turn the eight types into a practical lens, go through each step of your process and ask:
- Is this step done right the first time, or does it come back for correction? (Defects)
- Does anyone actually need what this step produces? And when? (Overproduction)
- How long does the request wait before and after this step? (Waiting)
- Is the skill of the person doing this step used, or is it done by someone more senior? (Talent)
- How many times does the request move between hands and systems? (Transportation)
- How many requests are queuing at this step? (Inventory)
- How many systems and screens does the employee move between to complete it? (Motion)
- What would the customer lose if we removed this step or this approval? (Extra-processing)
Where the case stands now: Hind spent a full day walking among her team’s desks with these eight questions in hand. She returned with two pages of notes, in which she saw in one day what years of reading reports had not shown her. Then she drew with the team a flow map of the request from start to finish.
“Walk for half an hour through the workplace of your process with the eight questions in hand. Do not write figures, write what you see with your own eyes.”
Removing waste without falling into the two traps
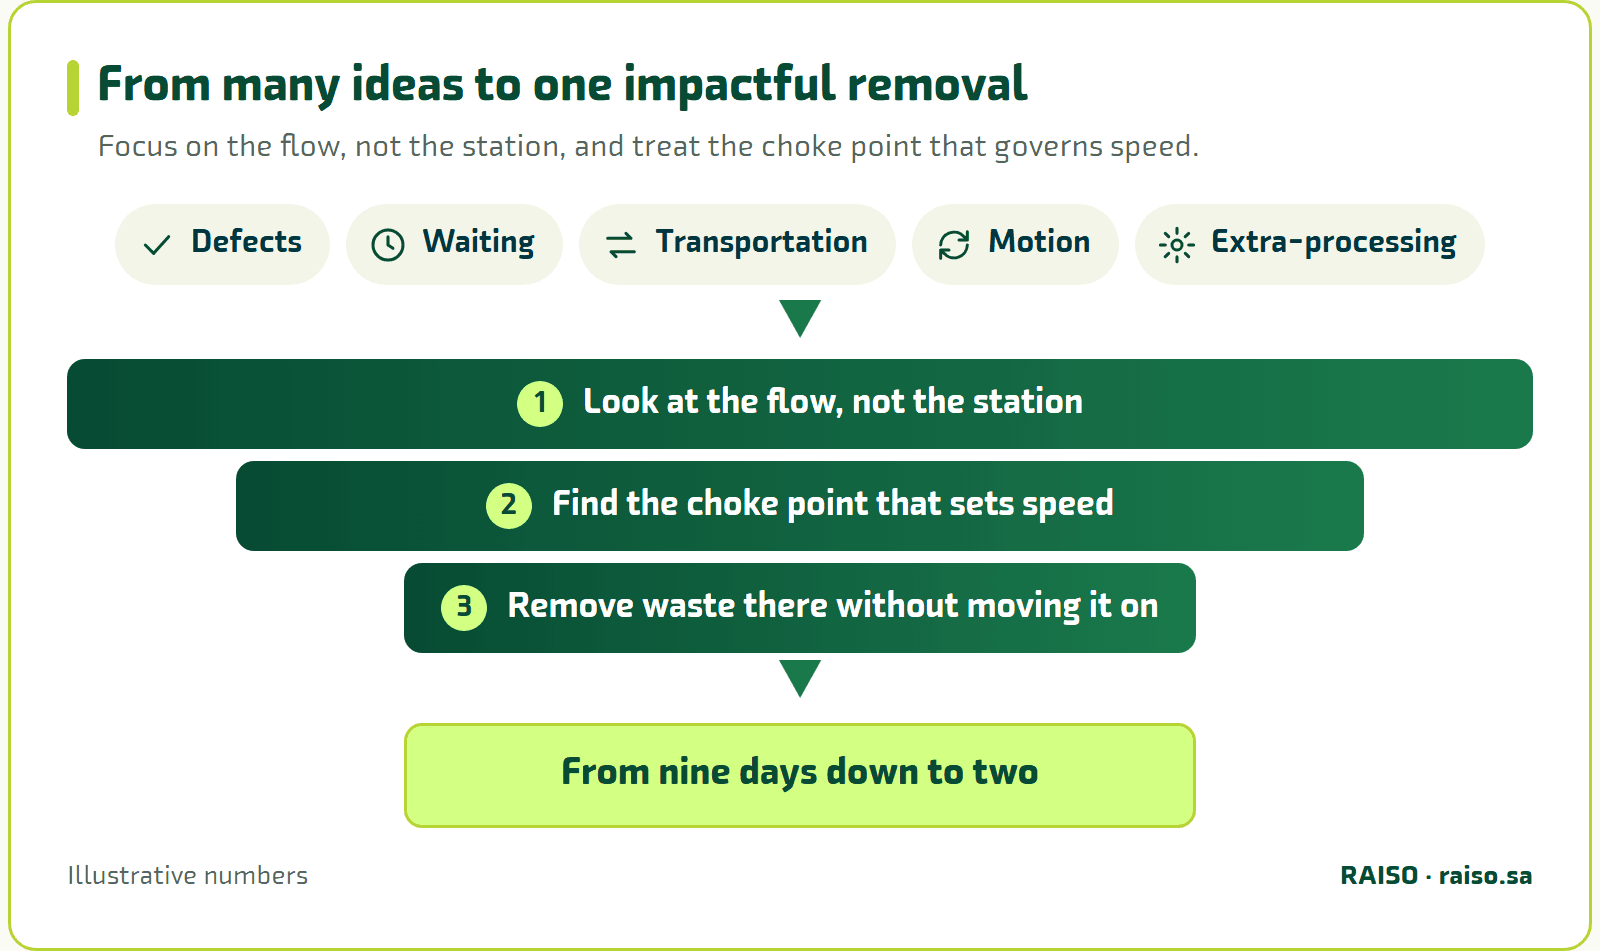
Seeing waste is a beginning, but removing it needs discipline to protect the organisation from two opposite traps. The first is chasing waste without priority: an enthusiastic team pounces on every waste it sees and scatters its effort over twenty small improvements whose sum makes no real difference. This is what nearly happened to Hind, who came out of her walking day with a list of thirty ideas.
The remedy is to focus on the flow, not the station. We do not ask where the biggest waste is in isolation, but where the choke point is that governs the speed of the whole process. Removing waste at a step that is not the bottleneck never speeds up final delivery, whereas treating the real choke point speeds up the entire process. So Hind picked just one of her thirty ideas: the approval where dozens of requests were stuck.
The second trap is local improvement that harms the whole: removing waste in one step in a way that piles it up in the next. The department that improves its numbers by throwing unfinished work to the next has not removed waste but moved it, and often multiplied it by adding transport and rework. The remedy is to look at the whole process from the customer’s viewpoint rather than at departments separately. We measure waste by its effect on the customer’s journey from request to delivery.
Finally, because waste in services is invisible, removing it is not a campaign launched once and finished, but a habit to be planted. The eight types never vanish for good. As soon as they are removed they begin creeping back with every new procedure, every new system, and every exception that turns into a rule. A mature organisation does not clean its processes once. It builds a permanent mechanism that sees waste and removes it continuously, and that is the heart of continuous improvement.
“A department that improves its performance by throwing unfinished work at the next has not removed waste. It has moved it.”
Where the case stands now: Hind removed the single choked approval, and a month later measured the update request again. Its time fell from nine days to two. She asked the team to pick another request each month and trace it the same way, so that waste does not return without anyone noticing.
“From the thirty improvement ideas in your head, pick only one: the one that removes the biggest choke point in the customer’s journey. Write it down, and decide who will carry it out and when.”
What you carry with you
We are back where we began: the largest losses of a service organisation appear in no financial report. They are buried in salaries paid for rework that should never have happened, in a cycle time swollen by waiting until it came to be seen as normal, in the minds of experts consumed by routine that does not need their expertise, and in customer trust eroding silently behind pending requests. This enemy is not defeated by a financial campaign, because it does not live in the financial statements. It is defeated by an eye that learns to see, a method that learns to measure, and a culture that refuses to accept waste as fate.
What we hope you carry with you:
- Waste in services is information and time
There is no heap to see. So it hides in the clothes of respectable work and is buried in salaries and cycle time.
- The eight types are a lens
Defects, overproduction, waiting, talent, transportation, inventory, motion and extra-processing. Eight questions to ask of every step.
- Look with your own eyes
Walking the workplace and value stream mapping reveal what reports do not.
- Measure one ratio
Value-adding time over total cycle time. It is the most honest measure of a process’s health.
- Focus on the choke point
Treat what governs the speed of the whole flow, and look through the customer’s eyes, not the department’s.
The advantage of service leaders is that a mine remains unextracted before them. In manufacturing, process efficiency was squeezed over decades until gaining one more percentage point became a battle. In many service organisations waste is untouched because it was invisible. That is why a first serious journey to reveal it often releases many quick gains: cycle time shrinking from days to hours, requests completed first time, and experts returning to what they were meant for. In the context of Vision 2030, which bets on high-efficiency services and an experience worthy of the beneficiary, this becomes a matter of competitiveness, not only internal improvement.
Begin tomorrow with one step: choose a process that matters to your beneficiary, trace one request in it from birth to closure, and calculate a single ratio: how much of its total time was spent adding value the beneficiary can feel. The number you see will be more eloquent than any report. And if you want to practise these tools with specialists on a process from your organisation, we recommend RAISO’s courses in process improvement and continuous improvement, where we draw the value stream map of a real process with you and identify its first choke point. Once the enemy has a name, a face and a number, it can be defeated.